(VIDEO RECORDING: https://vimeo.com/647014930)
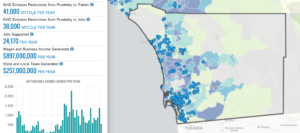
 The California Housing Partnership recently released new features and indicators in its Affordable Housing Map & Benefits Calculator data tool as part of a Phase II expansion which including new resources for upcoming affordable housing developments. Alongside the Partnership’s Housing Needs Dashboard, these online data tools provide users with the ability to view and share metrics on California’s supply of affordable rental housing, the social and economic benefits these affordable apartment homes contribute to their local neighborhoods, and the conditions in our regions and counties influencing housing need for low-income Californians.
Join us on Monday, November 15 at 1:00 pm for a one-hour demonstration and Q&A of the expanded data and features accessible in the new Affordable Housing Map & Benefits Calculator.
Sample research questions that can be answered:
- How many affordable homes are located in my city or Congressional district? Where are they located and where do they fall in terms of areas of opportunity?
- What types of social, economic, and environmental benefits are being generated by these affordable housing developments?
- Where are new affordable housing developments coming up soon in California?
- How much are households who live in our county’s affordable housing properties saving on rent per month?
- From a health and housing lens, how greatly have the social determinants of health improved for residents who are now affordably and stably housed?
- How much local economic activity, job creation, and tax revenue will be generated by our upcoming affordable housing development?
- How many estimated metric tons of greenhouse gases (GHG) are being saved due to the locational efficiency of our community’s new affordable housing property?
