
 What social and economic benefits are generated when we relieve low-income families of housing insecurity and rent burden? Or when we help households move to healthier higher resource neighborhoods? How much local economic activity, job creation, and tax revenue is generated when we build and preserve affordable housing?
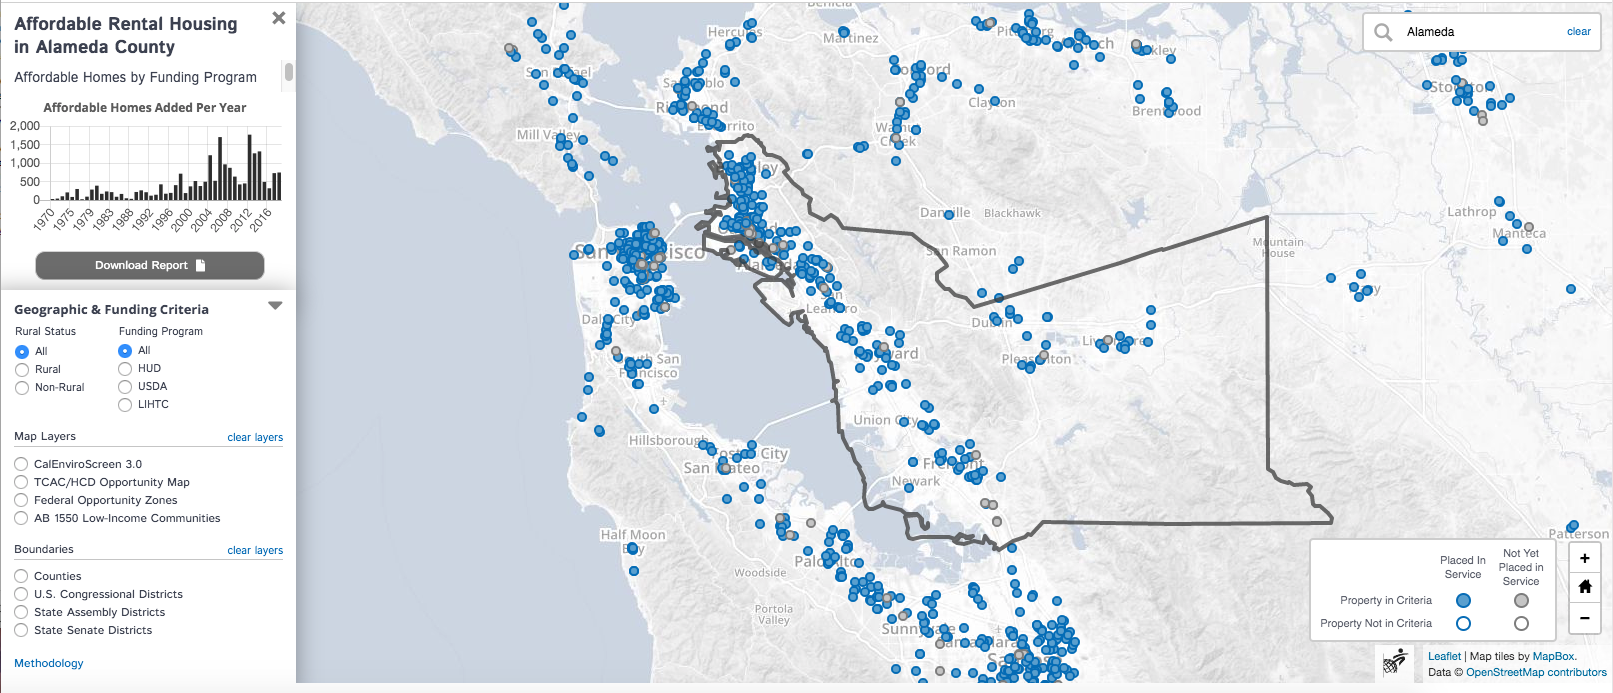
To help answer these questions, the California Housing Partnership recently launched the Affordable Rental Housing Benefits Map, a one-stop, interactive mapping tool for viewing and downloading data on affordable housing and its benefits throughout California. While initial responses have been very positive, a number of people have said they would appreciate more information on how to use the Benefits Map.
In response, I have created a short video tutorial embedded directly on the Benefits Map landing page. In just four minutes, you can learn more about the Benefits Map, how to view data on individual affordable housing developments, aggregate data for a specific county or legislative district, download reports, generate your own maps, and track trends over time.
To check out the video tutorial and explore the Benefits Map for yourself, click here. Once you have looked at the Map, please let us know as we have big plans for this tool in the future and would love to hear your feedback.