

Post updated on 9/24/2020 at 1:10 pm
The California Housing Partnership recently updated the Housing Needs Dashboard to include the most current data on how well California’s cities and counties are meeting their regional housing goals for different income groups. This new data reveals not only that nearly every city and county in California is failing to meet its production goals for housing affordable to low-income households, but also that many jurisdictions have already exceeded their high-income (or above moderate-income) housing goals.
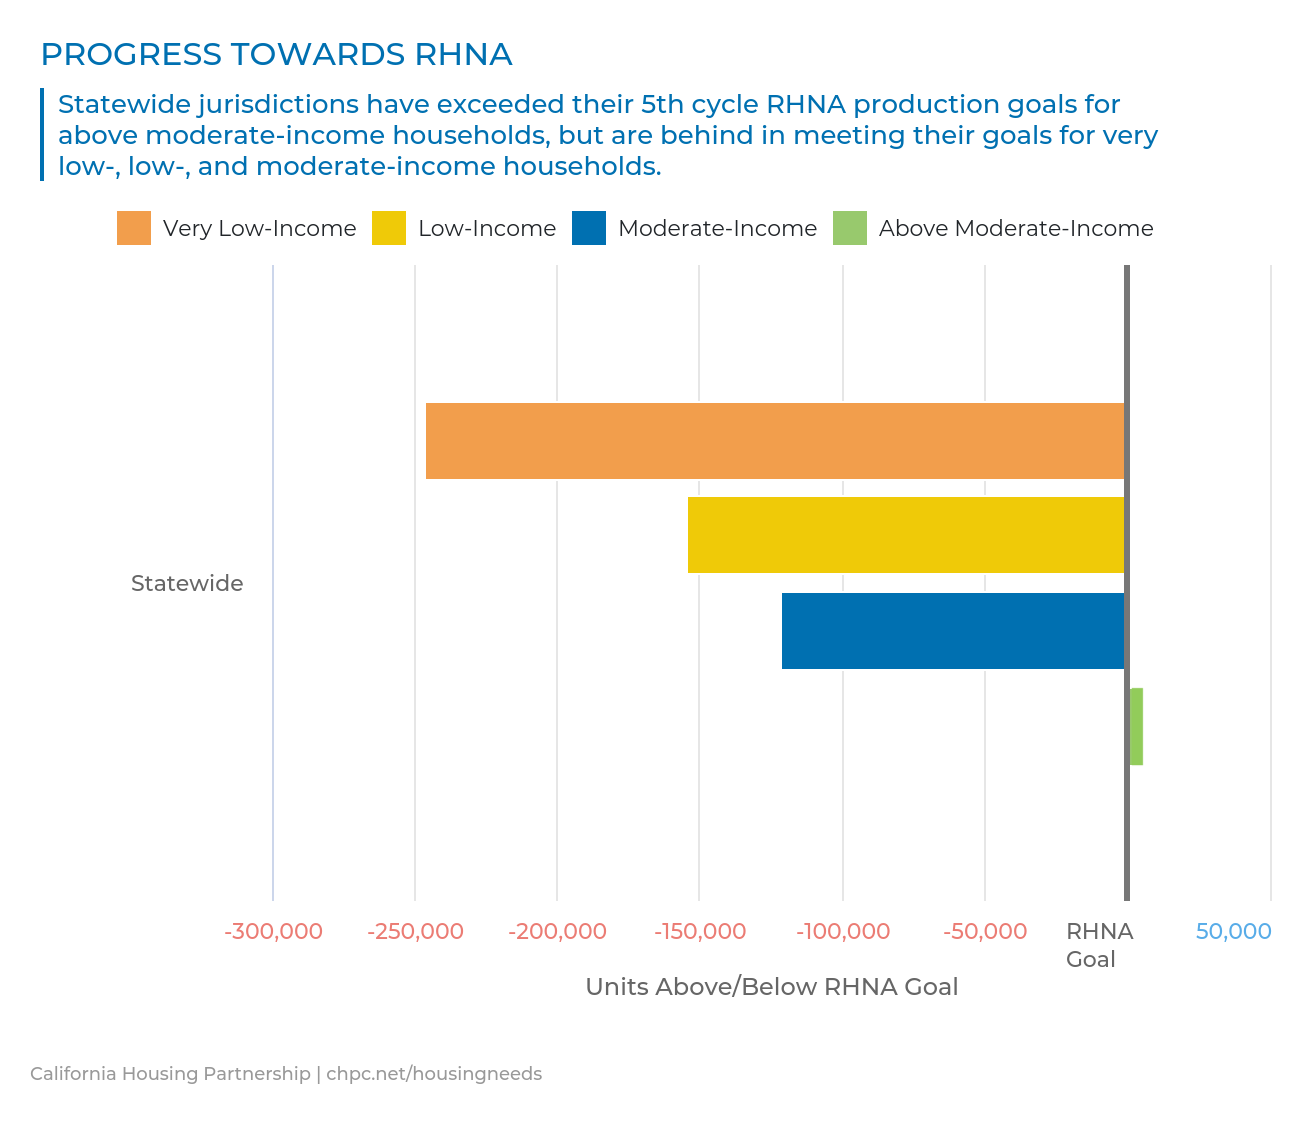
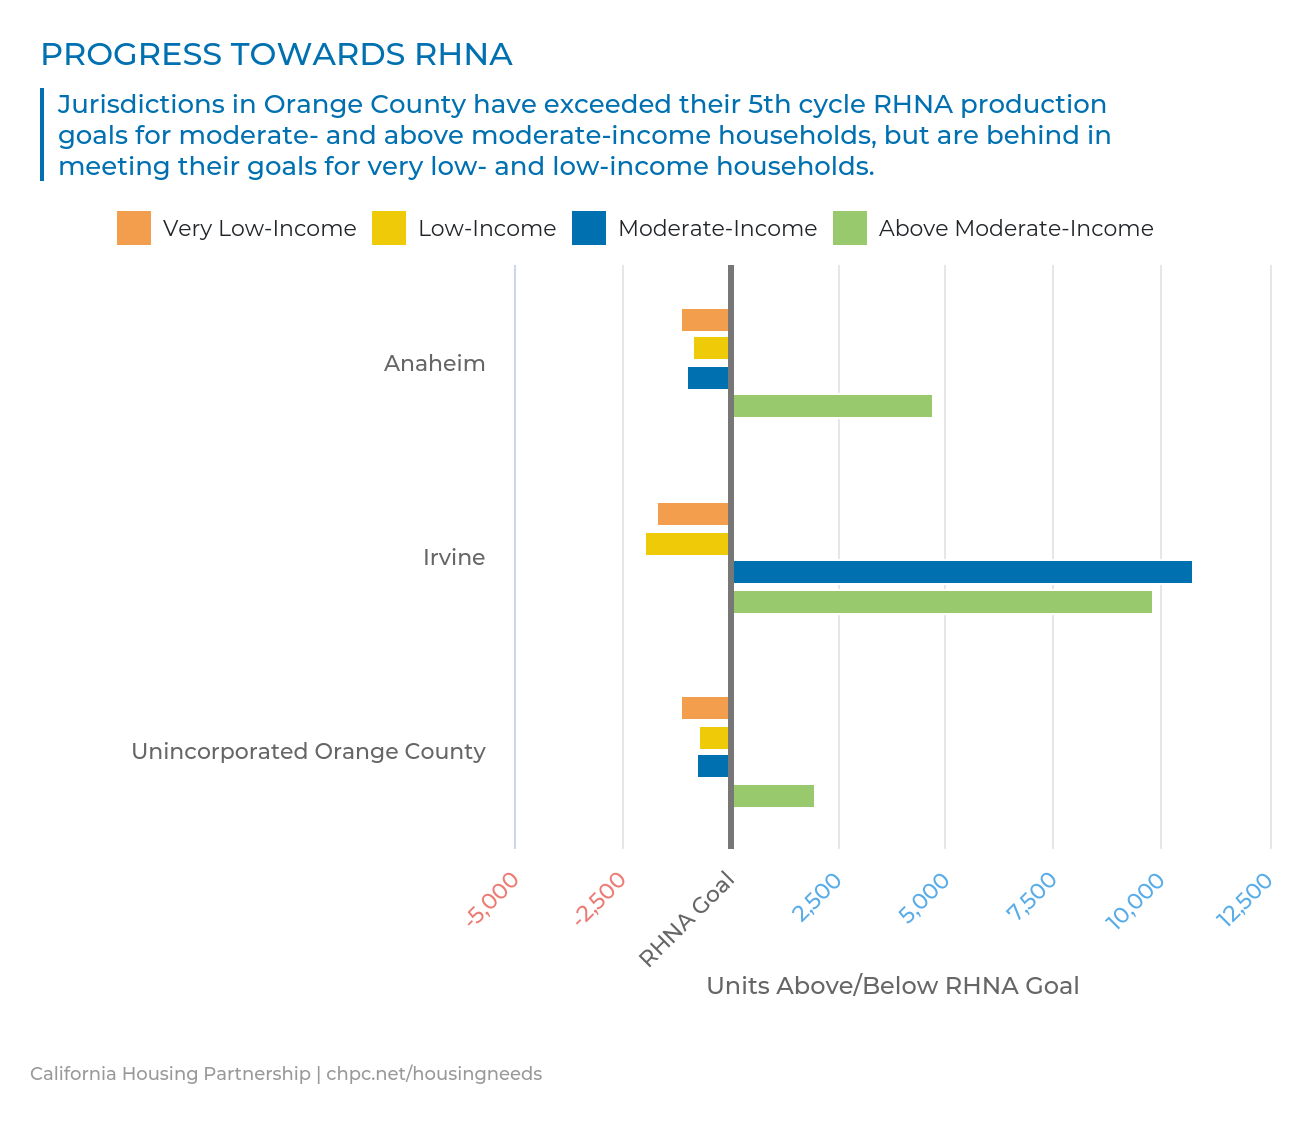
NOTE: Bars to the left of the y-axis (below zero) represent the number of new homes the jurisdiction still needs to permit to meet the housing needs of each specified income group. Bars to the right of the y-axis (above zero) indicate a jurisdiction has exceeded its RHNA production goal for the specified income groups.
State law requires California cities and counties to plan for the housing needs of residents of all incomes. This mandate, called the Housing Element, is part of each jurisdiction’s General Plan. As part of this process, the California Department of Housing and Community Development (HCD) determines the total number of new homes each region needs to build – and how affordable those homes need to be. This process is called the regional housing needs assessment (RHNA) and occurs every five to eight years or “cycle.” California is now in its fifth housing element and RHNA update cycle.
Every year, each jurisdiction must submit an annual progress report (APR) to HCD on the jurisdiction’s progress in implementing its housing element. According to 2019 APR data – the most current data available – jurisdictions statewide are not permitting enough very low-income and low-income housing units to meet their region’s estimated need. As a result, more than 400,000 affordable homes are still needed to meet the state’s 5th cycle RHNA goals. Meanwhile, jurisdictions have exceeded their RHNA production goals for above moderate-income households earning more than 120% AMI by 2,106 homes or 0.4%.
STATEWIDE 5TH CYCLE RHNA PROGRESS BY INCOME GROUP (2019)
Income Group |
|
Housing Production Goal (5th Cycle RHNA) |
|
Permits Issued through 2019 (5th Cycle RHNA) |
|
% of Production Goal Met |
|
Very Low-Income (<50% AMI)
|
|
278,484
|
|
31,725
|
|
11.4%
|
|
Low-Income (50%-80% AMI)
|
|
185,525
|
|
31,262
|
|
16.9%
|
|
Moderate-Income (80-120% AMI)
|
|
204,917
|
|
83,317
|
|
40.7%
|
|
Above Moderate-Income (>120% AMI)
|
|
487,906
|
|
490,012
|
|
100.4%
|
To see this data for yourself in an interactive format, please go to chpc.net/housingneeds. Simply select up to four geographies, press “See Results,” and view the “Progress Towards RHNA” graphic in the “Production & Preservation” tab. The dashboard will then provide you with results for up to the three jurisdictions with the largest RHNA allocations in the selected county so that you can see how each is performing on its 5th cycle RHNA production goals by income group. In Orange County, for example, Irvine, Anaheim, and unincorporated Orange County have exceeded their 5th cycle RHNA production goals for above moderate-income households – by 293%, 287%, and 191%, respectively – but are behind in meeting their goals for lower income households.
An affordable home is so much more than just a roof over one’s head – a fact that is reinforced by the Partnership’s Affordable Housing Benefits Map and decades of academic research. The coronavirus pandemic has made this an even more important discussion, as the analysis conducted by the Partnership on disparate impacts in housing fragility reveals. An affordable home is the foundation of stability, health and wellness, safety and economic opportunity, and we must do more to accommodate the housing needs of all Californians.
If you are interested in learning more about potential federal and state policy responses to the shortage of affordable homes and the pandemic, check out these useful resources from the Partnership:
-
COVID-19 Response – Research, webinars, federal and state policy recommendations
-
Legislative & Regulatory Advocacy – 2020 bills co-sponsored and/or supported by the Partnership
-
Trainings and Briefings – Panels and trainings from experts on the affordable housing field’s most relevant issues
 Please visit the Partnership’s Housing Needs Dashboard to discover and compare housing data for every California county and the state overall, including:
- Affordable housing need versus supply
- Housing market condition indicators
- Federal and state affordable housing funding levels
- Multifamily housing production and preservation trends