
The California Housing Partnership is pleased to announce that based on input from focus groups and users, we have upgraded our interactive online Housing Needs Dashboard — first introduced last year — to include new indicators, data and functionality:
1) Cost Burden by Race and Ethnicity: Housing Need tab
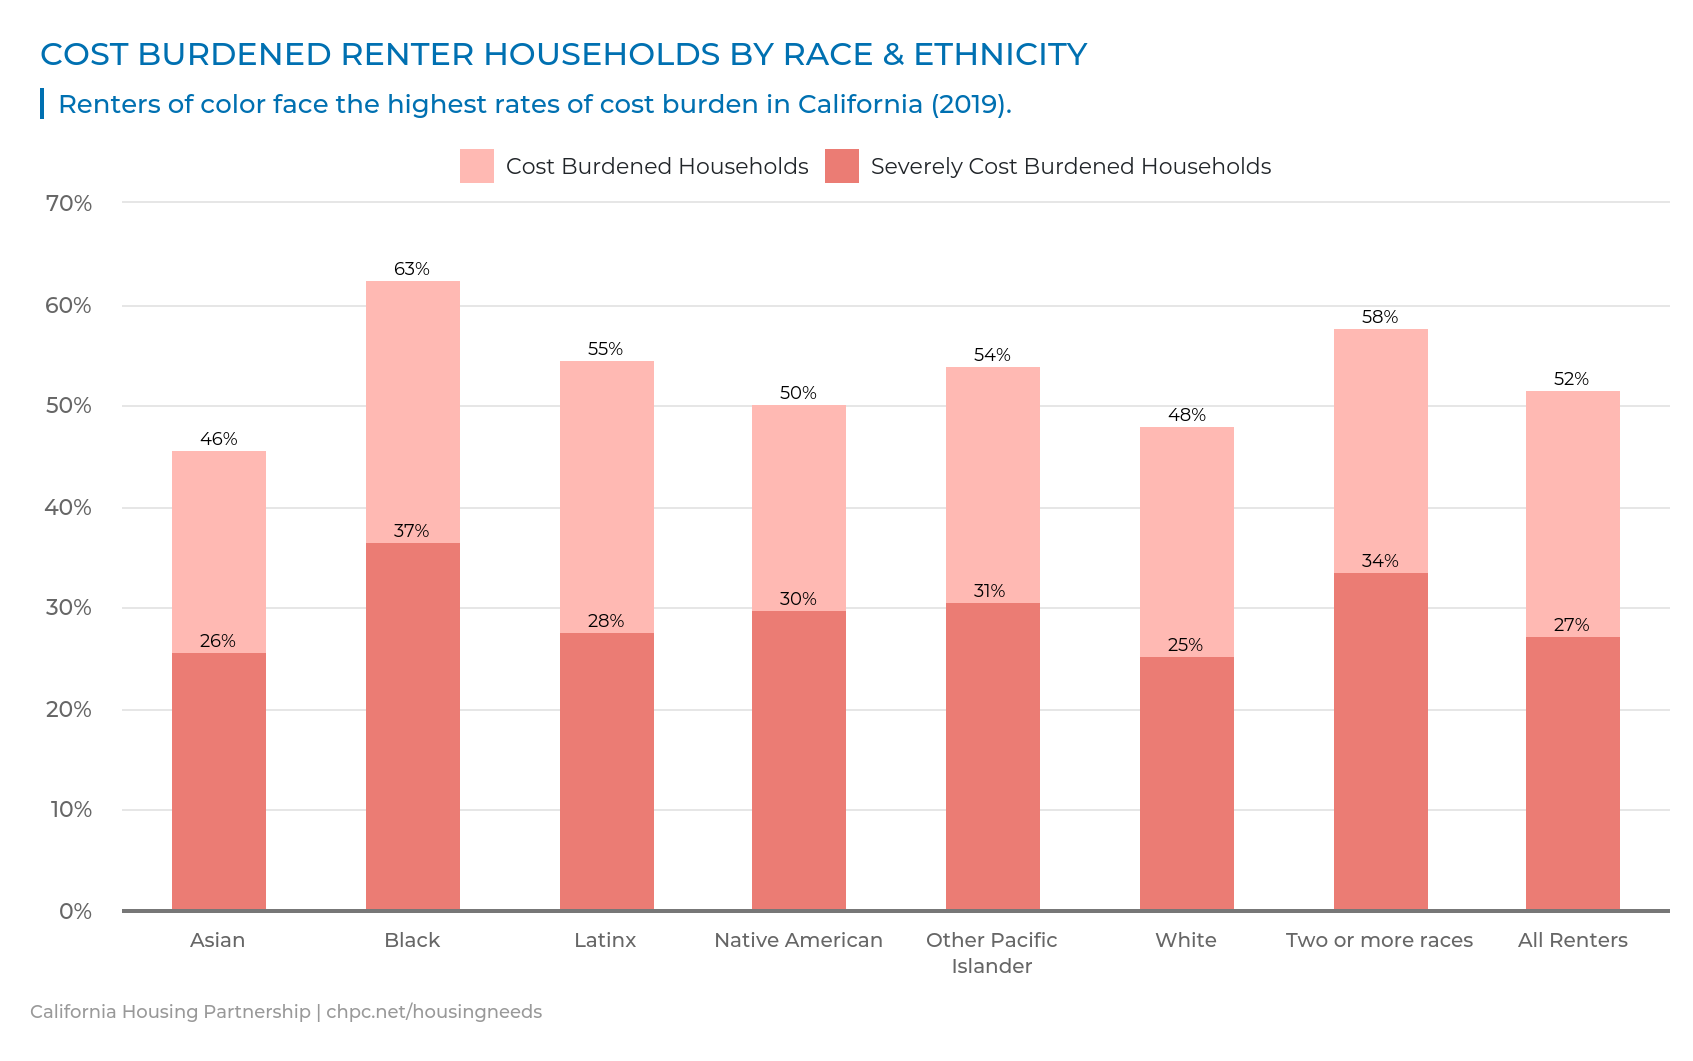
Racial disparities in access to a safe, stable, and affordable home have long defined California’s housing crisis: renters of color are more likely to experience housing cost burdens, homelessness, and housing instability, due in large part to California’s long history of discrimination in public and private housing markets, structural racism, and government-sponsored segregation. To better track these trends in housing affordability, the Dashboard now includes an analysis of cost burden by race and ethnicity, measuring rent affordability for different race and ethnic groups by calculating the percentage of income that households pay for housing.
2) Housing for Unsheltered Persons: Housing Need tab
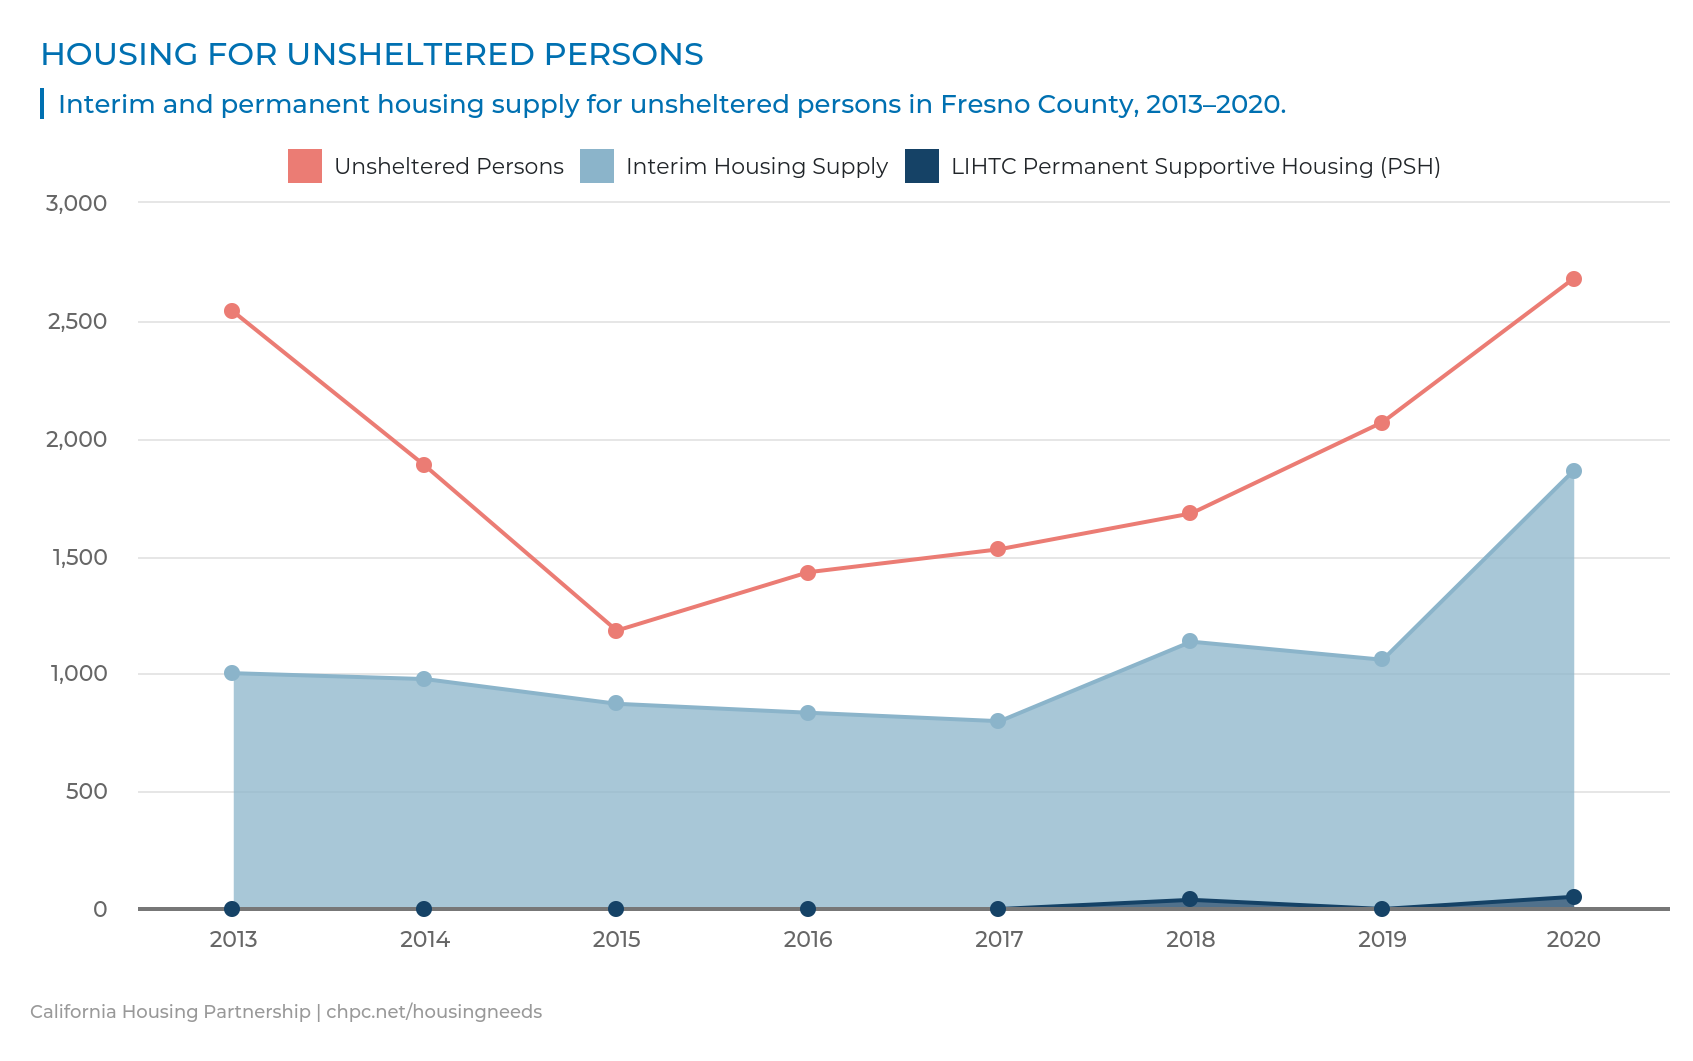
As the number of unhoused individuals continues to climb in most of California, this new graphic gives a historical look at this annual count compared to the supply of temporary and permanent housing each year.
3) Historical Asking Rents by quarter: Market Trends tab
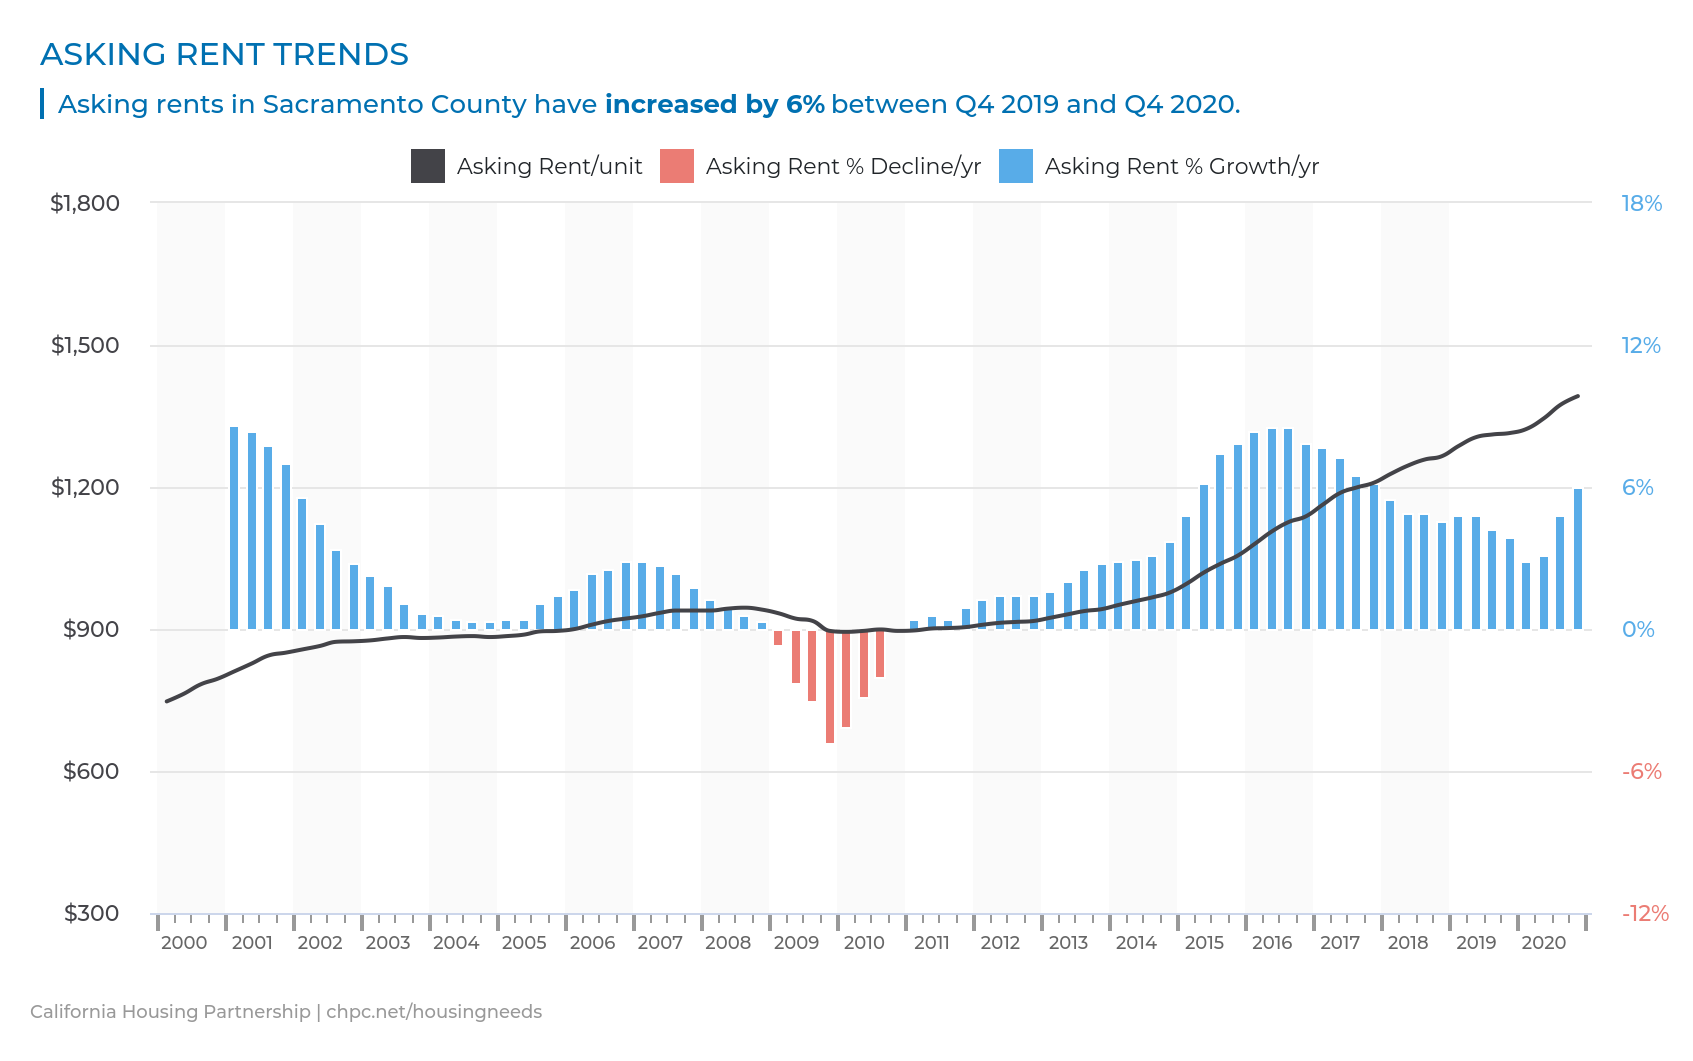
As a result of the COVID-19 pandemic, asking rents throughout the state underwent noteworthy shifts in 2020 with significant increases and decreases occurring quarter-to-quarter as the year progressed, and some counties experiencing their first average rent decreases since the Great Recession. With this in mind, the Asking Rent Trends graphic in the Dashboard now displays quarterly rent data, to better show the changes in rent that occur not just across years but within the quarters of each year and to provide users with a more detailed understanding of asking rent trends over the last decade.
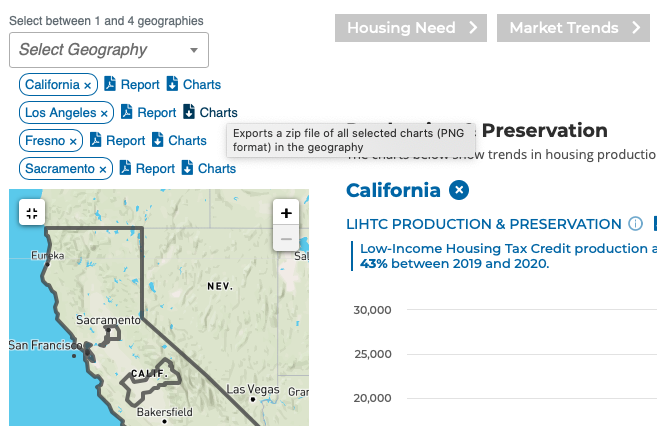
4) Historical Low-Income Housing Tax Credit (LIHTC) Production and Preservation since the founding of the program: Production & Preservation tab
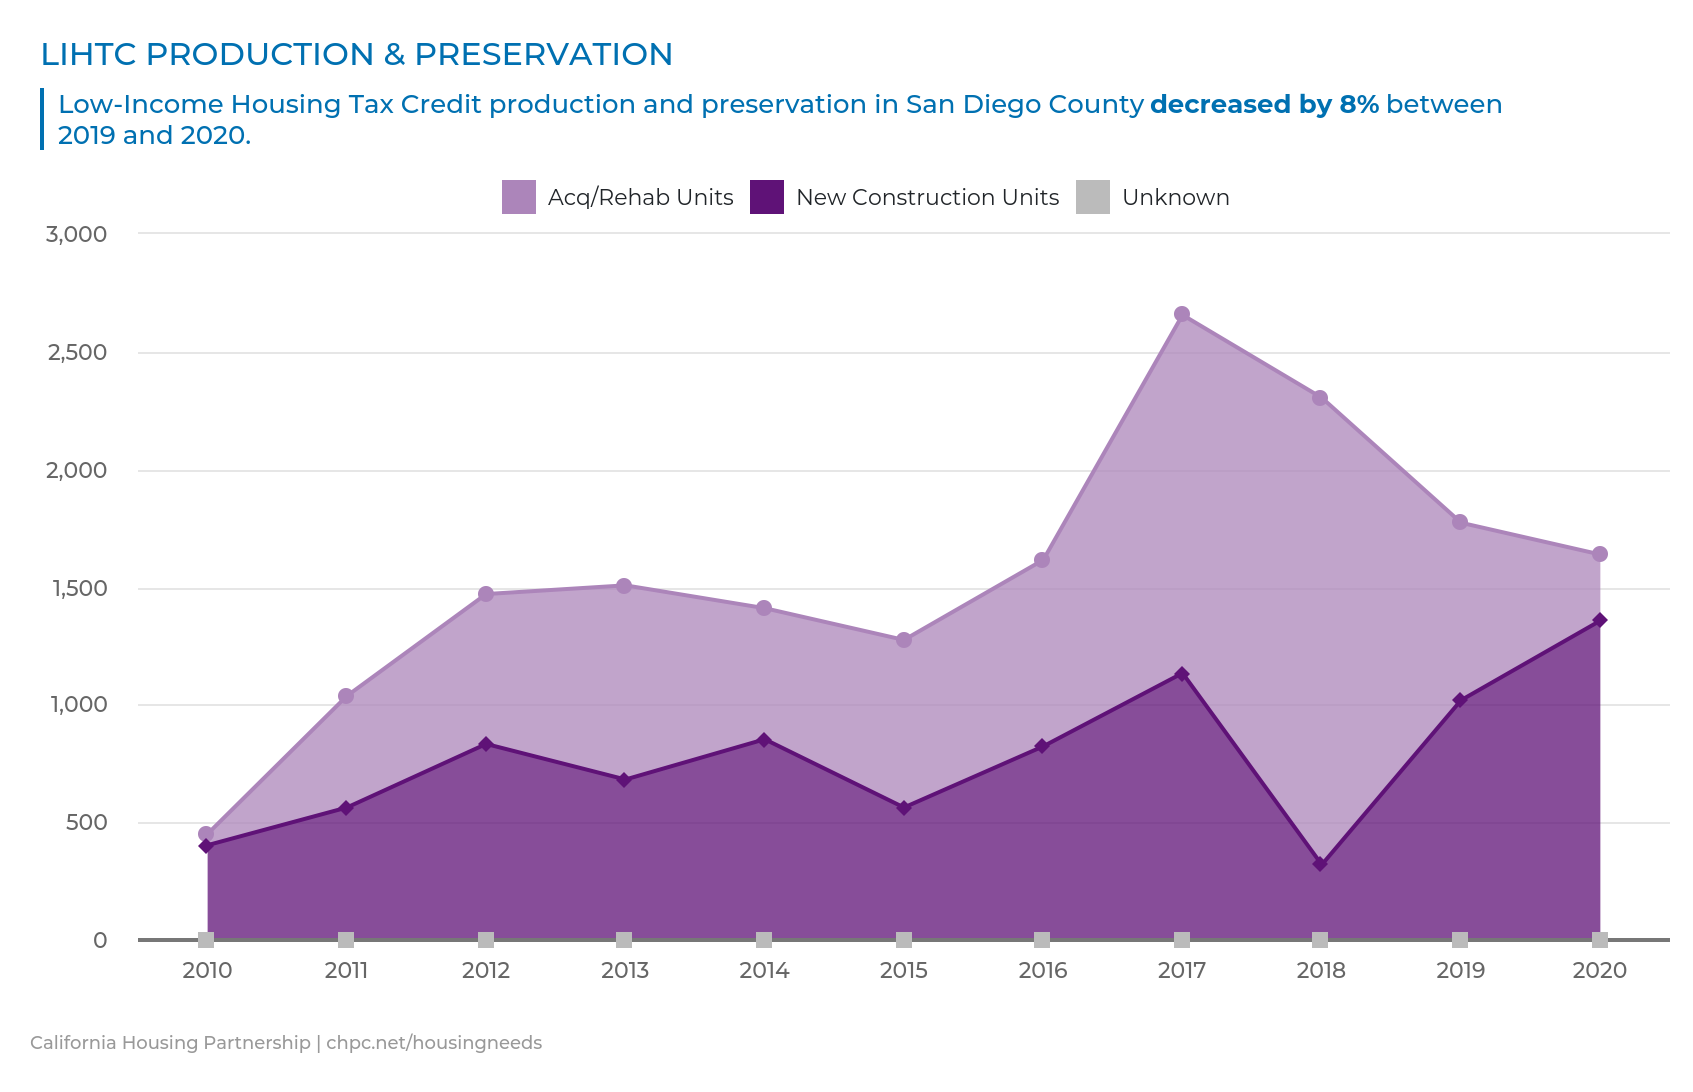
The Low-Income Housing Tax Credit (LIHTC) program has been responsible for the creation of over 430,000 affordable units in the state of California. In order for tool users to have a more comprehensive look at its accomplishments over time, the LIHTC Production and Preservation graphic in the Dashboard has been expanded to include all 34 years of data dating back to the first developments awarded credits in 1987. The Dashboard now allows users to select the full range (1987-2020) or any period of interest, and view it in both chart form or as a data table.
5) Regional aggregations of county-level data: See sidebar dropdown
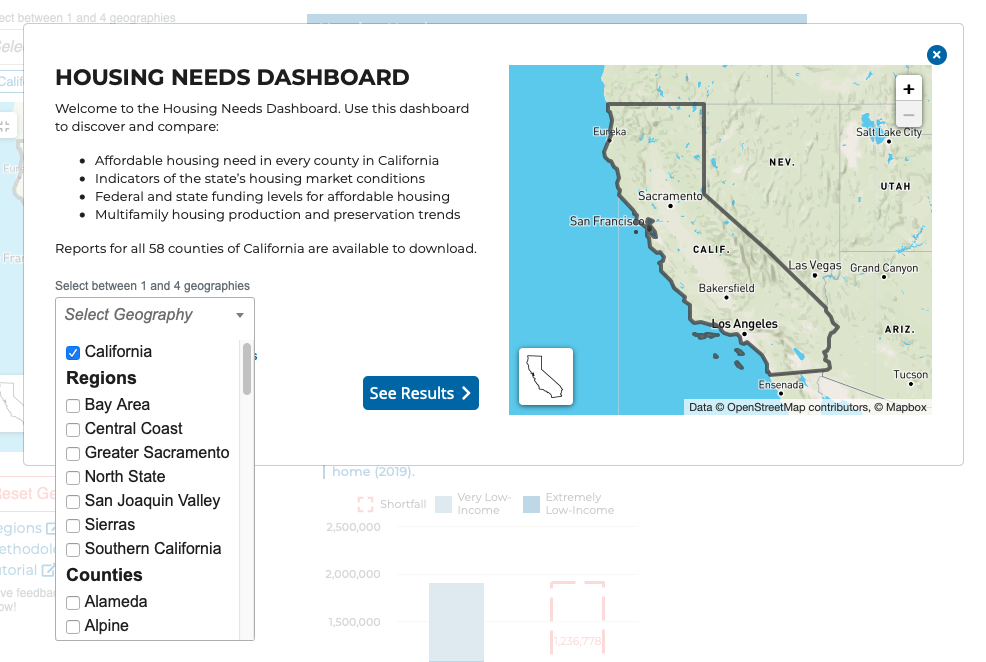
To better assist regional advocacy organizations, planners, and governing bodies, the Partnership added the ability to view aggregated regional data, available through the dropdown in the left sidebar or the landing page. (View: List of Regions.)
6) Batch PNG downloads of all charts in a geography: See sidebar dropdown
_
COMING SOON THIS FALL:
(Webinar) Data-Driven Housing Advocacy: Research Tools for Your Work