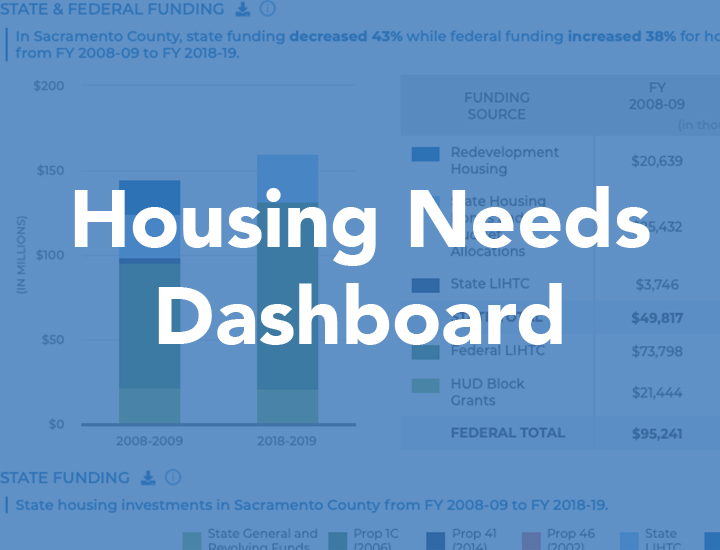
The California Housing Partnership is excited to announce the launch of a new
Housing Needs Dashboard, an interactive online affordable housing data portal. The Partnership designed the dashboard as a tool through which policymakers, planners, affordable housing providers, and advocates can access key California housing metrics and track indicators over time at both the state and county level.
“We hope the Housing Needs Dashboard will become an essential tool for federal, state and local policymakers to identify key affordable housing trends and challenges in their districts,” says Matt Schwartz, president and CEO.
This new online dashboard transforms the former annually published
Housing Needs Reports into dynamic, interactive and customizable reports, while retaining the main elements that industry professionals, government leaders, and the media have come to rely on. The dashboard includes all fifty-eight counties of California, and metrics for up to four counties at a time can be viewed side-by-side.
The Housing Needs Dashboard categorizes California housing metrics and indicators into four sections:
-
Housing Needs
-
Market Trends
-
State and Federal Funding
-
Productions and Preservation
The following is a sample of the variety of indicators graphically displayed in the dashboard:
|

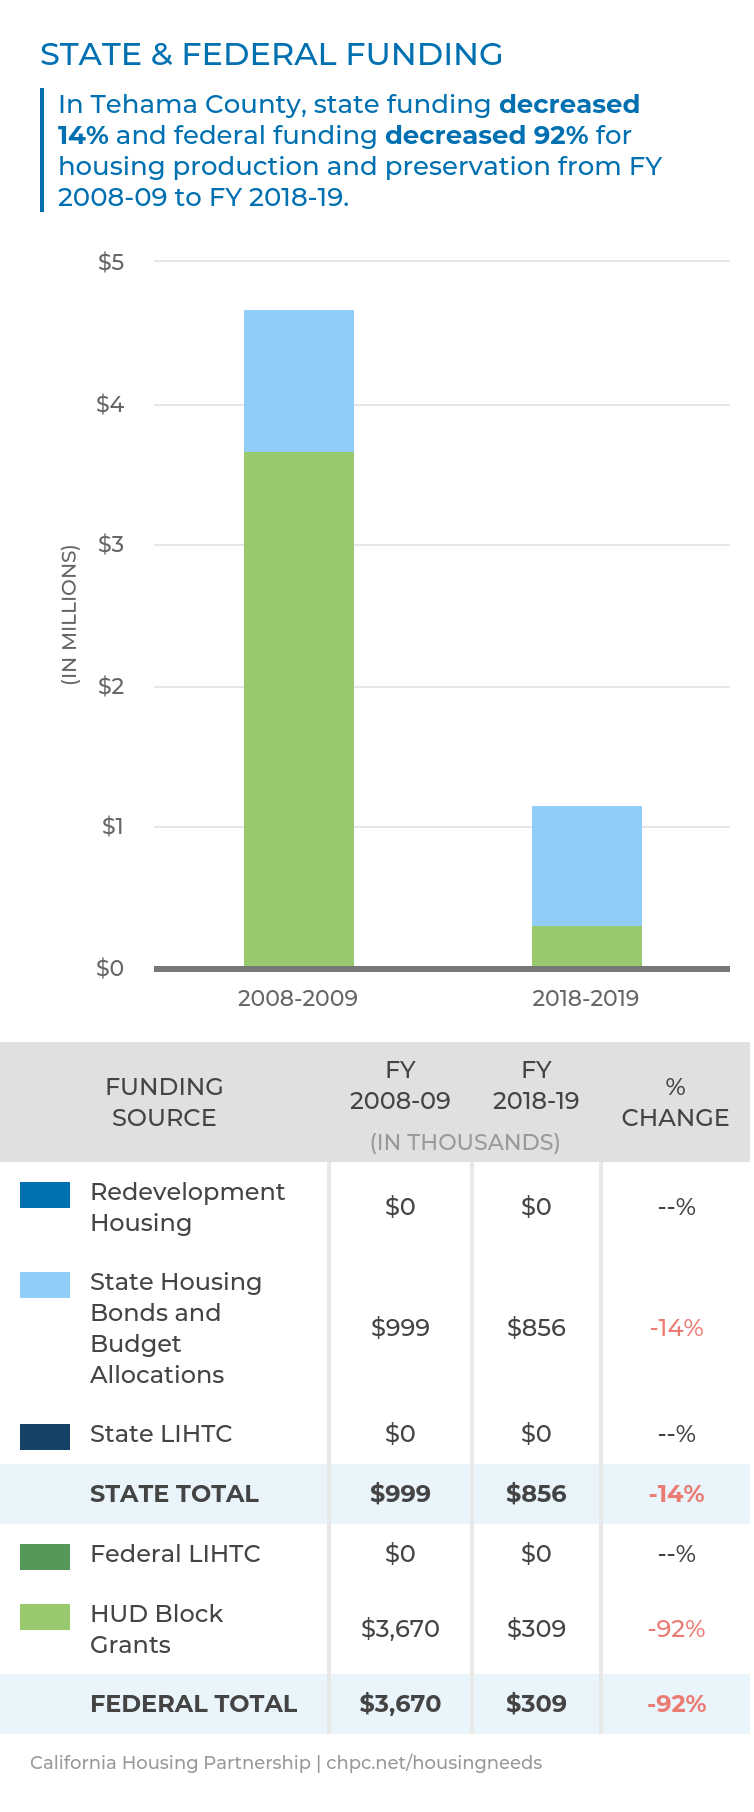
STATE & FEDERAL FUNDING
In Tehama County, state funding decreased 14% and federal funding decreased 92% for housing production and preservation from FY 2008-09 to FY 2018-19.
|
|
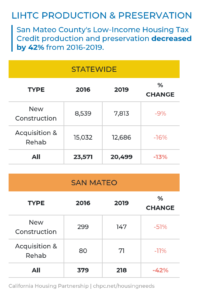
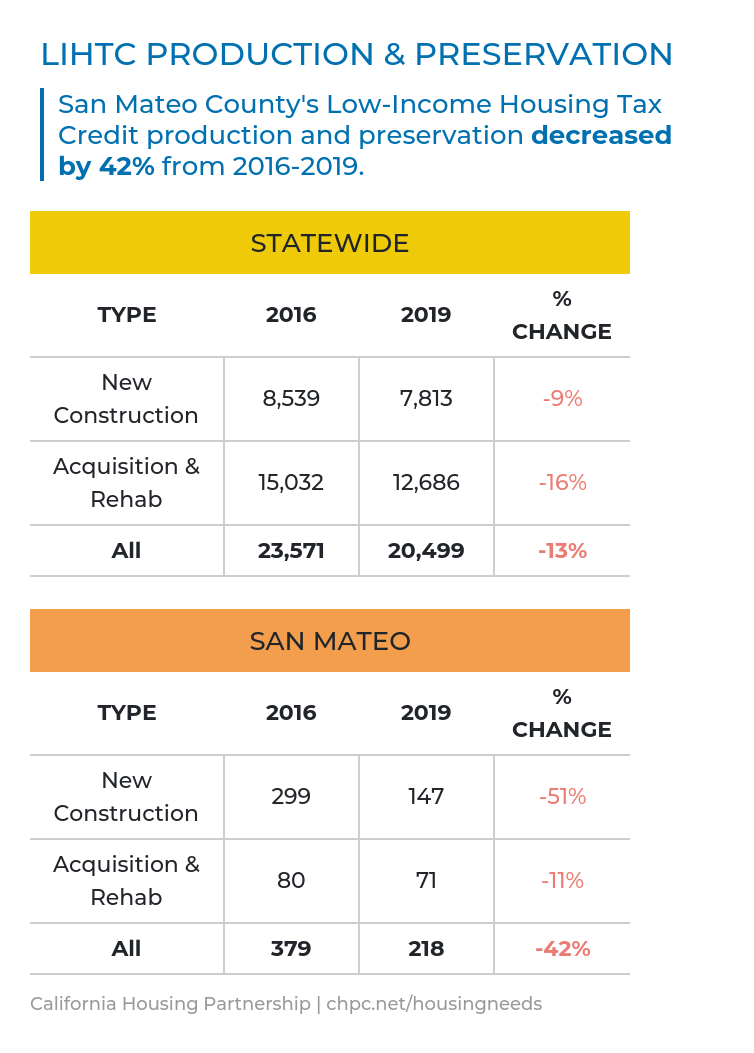
LIHTC PRODUCTION & PRESERVATION
San Mateo County’s Low-Income Housing Tax Credit production and preservation decreased by 42% from 2016-2019.
|
|
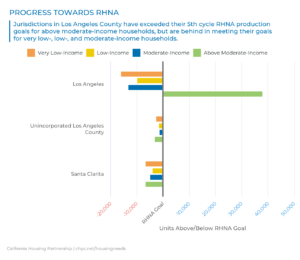
PROGRESS TOWARDS RHNA
Jurisdictions in Los Angeles County exceeded their 5th cycle RHNA production goals for above moderate-income households, but are behind in meeting their goals for very low-, low-, and moderate-income households.
|
|
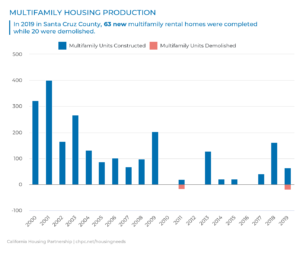
MULTIFAMILY HOUSING PRODUCTION
In 2019, developers in Santa Cruz County completed 63 new multifamily rental homes while demolishing 20 for a net gain of 43.
|
|

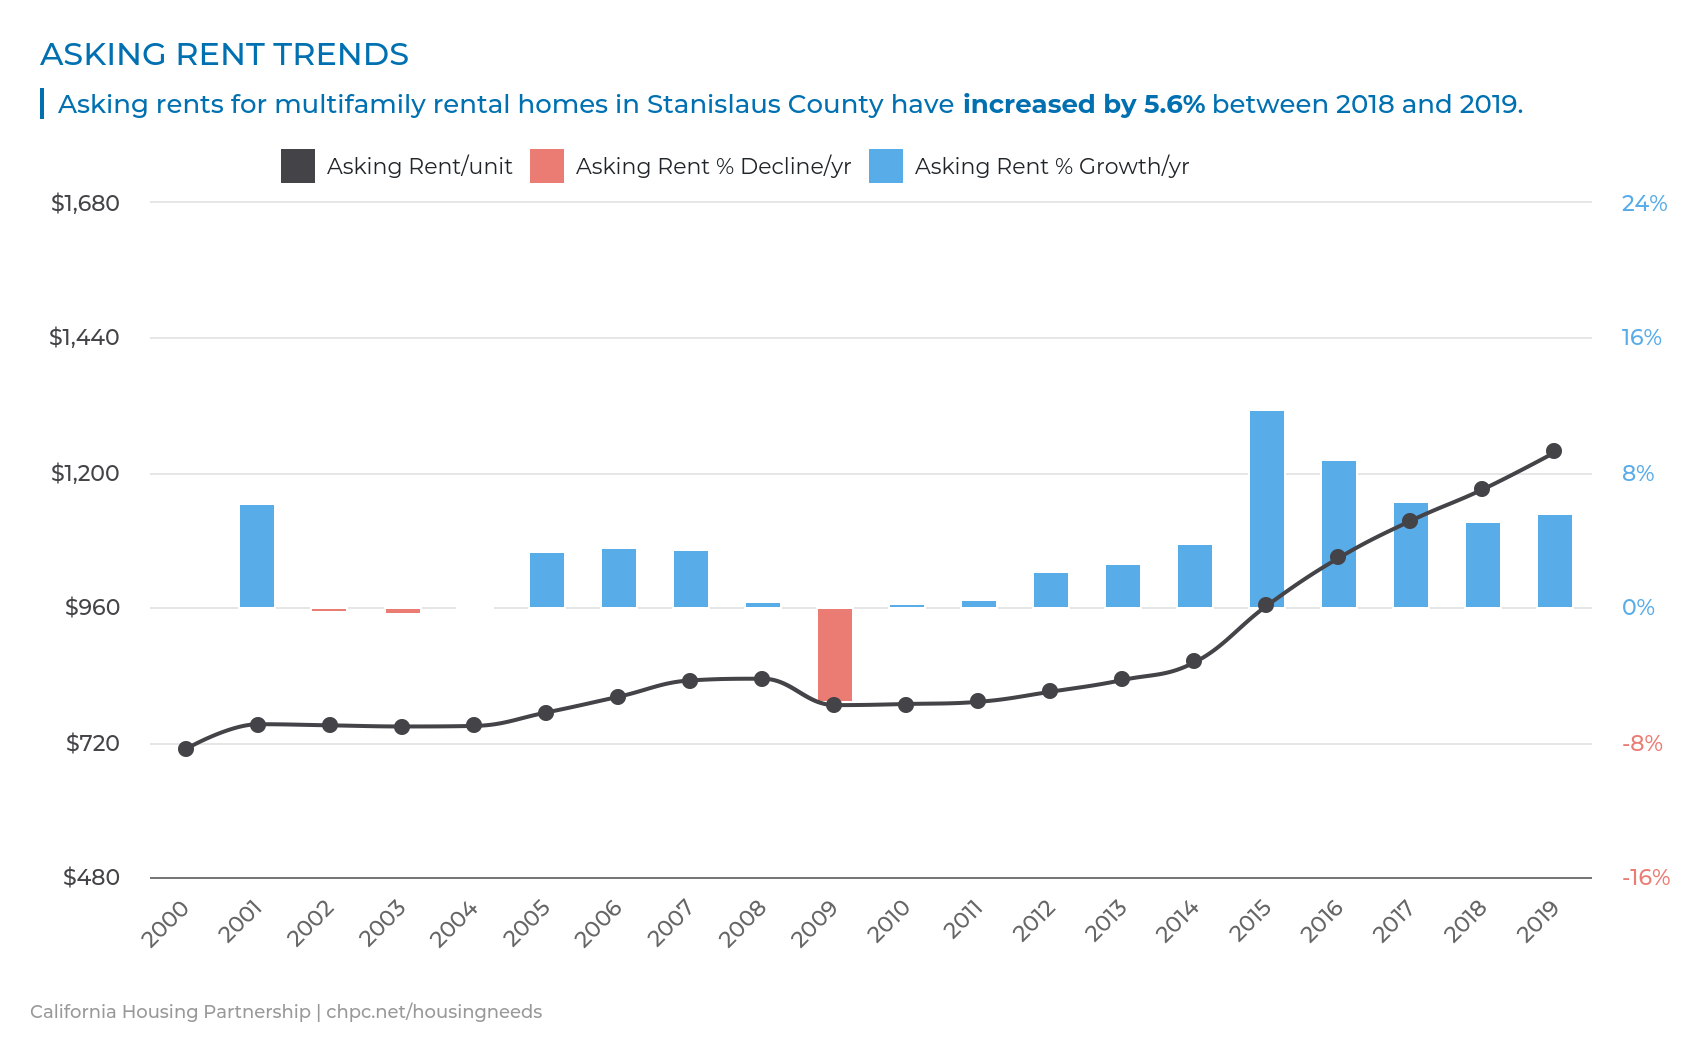
ASKING RENT TRENDS
Asking rents for multifamily rental homes in Stanislaus County increased by 5.6% between 2018 and 2019.
|
|
|
The Partnership will update housing statistics and key findings on an annual or semi-annual basis as new information from the dashboard’s input sources becomes available. Visit our website to read more about the Housing Needs Dashboard Methodology and Sources.
Special thanks to our advocacy partners who provided input to refine the dashboard:
- California Coalition for Rural Housing
- California Housing Consortium
- Housing California
- Kennedy Commission
- Non-Profit Housing Association of Northern California
- Sacramento Housing Alliance
- San Diego Housing Federation
- Southern California Association of Non Profit Housing
Look for details soon to join us next month for a webinar demonstration of the ins and outs of the new Housing Needs Dashboard on July 9th at 11:30 am. Our speakers will include our research team and president and CEO, Matt Schwartz.
Lead Project Sponsor: