
The California Housing Partnership is pleased to announce the launch of the next phase of our Affordable Housing Map & Benefits Calculator! The newly expanded data tool serves as a comprehensive inventory of California’s state- and federally-subsidized affordable housing and now includes a forward-looking Benefits Calculator that enables policymakers, planners, affordable housing providers and advocates to estimate the social, economic, and environmental benefits of prospective affordable housing developments. Additionally, this update also includes newly-added health and environmental indicators, increased data on state funding programs, and a new search filter for city-level details.
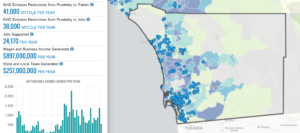
Sample datapoints from the California Affordable Housing Map & Benefits Calculator:
- Greenhouse gas emissions in the City of Los Angeles are being reduced by 190,000 metric tons of CO2 annually due to the locational efficiencies of its affordable housing properties.
- Affordable housing in Fresno County supports 9,860 jobs annually and generates $380 million in wages and business income each year.
- In Senate District 5, affordable housing supports 4,910 jobs annually and generates $188 million in wages and business income each year.
- A typical household living in an affordable home in the City of San Jose saves $860 monthly in rent.
- A typical household living in an affordable home in the City of Santa Barbara saves $1,290 monthly in rent.
“We hope that this newly-updated data tool will provide insights not only to government officials and planners but also to neighbors about the benefits to all of us of welcoming more affordable homes into our communities,” says Matt Schwartz, president and CEO.
- Total Rent Savings (per year)
- Household Rent Savings (per month)
- Medical Cost Savings from Reductions in Severe Obesity & Diabetes (per year)
- Medical Cost Savings from Reduction in Pediatric Asthma ED Visits (per year) — NEW
- Pediatric Health Savings from Living in a Lower Poverty Community (per year) — NEW
- Jobs Supported (per year)
- Wages and Business Income Generated (per year)
- State and Local Taxes Generated (per year)
- GHG Emission Reductions from Proximity to Transit (MTCO2 per year) — NEW
- GHG Emission Reductions from Proximity to Jobs (MTCO2 per year) — NEW
- Lifetime Earnings Boost (per child housed)
Data in the Affordable Housing Map & Benefits Calculator is available at the state level (California) and by county, congressional district, city and individual property address. Each geography can be easily exported as a PDF report. Underlying data is updated on an annual or semi-annual basis as new information from each input source becomes available. Visit our website to read more about the Methodology and Sources.
COMING SOON!
Bring your questions next month to our webinar: “Evidence-Based Affordable Housing: Data Tools for Your Work” on Monday, November 15 at 1:00 PM. See how your strategic work and advocacy narratives can become more compelling with data and visuals from the California Affordable Housing Map & Benefits Calculator, as well as our other data tools. Our speakers will include Research Team members Anthony Carroll and Lindsay Rosenfeld, with an introduction from our new research director, Anthony Vega.
Register for the event here.
Please review our Terms of Use when citing data from the California Housing Partnership.