Housing advocates, agencies, policymakers, and developers in California understand that we need to build more – much more – to meet current and future housing needs, particularly affordable homes for those with low incomes. At the same time, the State’s housing production goals can feel so large and daunting that they stand apart from the day-to-day practices of housers working within the constraints of the current operating environment.
But if we are to take seriously the charge to achieve housing abundance and provide affordable homes to all in California who need them now and into the future, we should not lose sight of State production goals – aspirational as they may seem – and instead should actively chart the path to achieve them.
The analysis below provides one vantage point into the scale of change needed to achieve production goals, focusing on affordable homes for low- and very low-income households. Specifically, we show the difference between what we can theoretically build each year, given current capacity, and what we should be building over the next several years to achieve State goals in the current planning cycle.1 In addition, while this analysis focuses primarily on the issue of development capacity, we would be remiss in not pointing out that dramatic increases in State funding would be required to achieve these production goals.2
Current development capacity
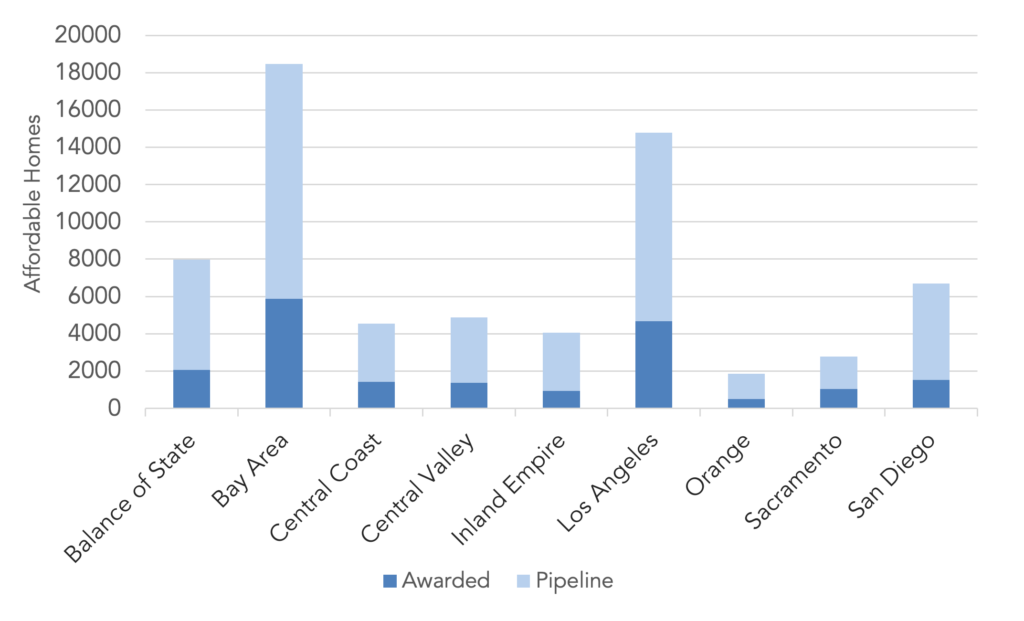
We estimate the current annual statewide affordable housing production capacity – what we can theoretically build3 – to be approximately 66,000 affordable homes. This total includes the approximately 19,400 newly created affordable homes in developments that have been fully funded each year in recent years4 and approximately 46,600 new construction affordable homes in the “pipeline”5 that are currently in the final stages of predevelopment but which have not been fully funded. Specifically, pipeline developments are those which recently applied for State gap financing and/or Low Income Housing Tax Credits (Housing Credits) but did not receive awards and thus could not begin construction, based on recent analysis from Enterprise Community Partners.6 Figure 1 shows the distribution of this capacity by region.
Figure 1: Estimated Annual Affordable Housing Production Capacity

Gap between capacity and State production goals
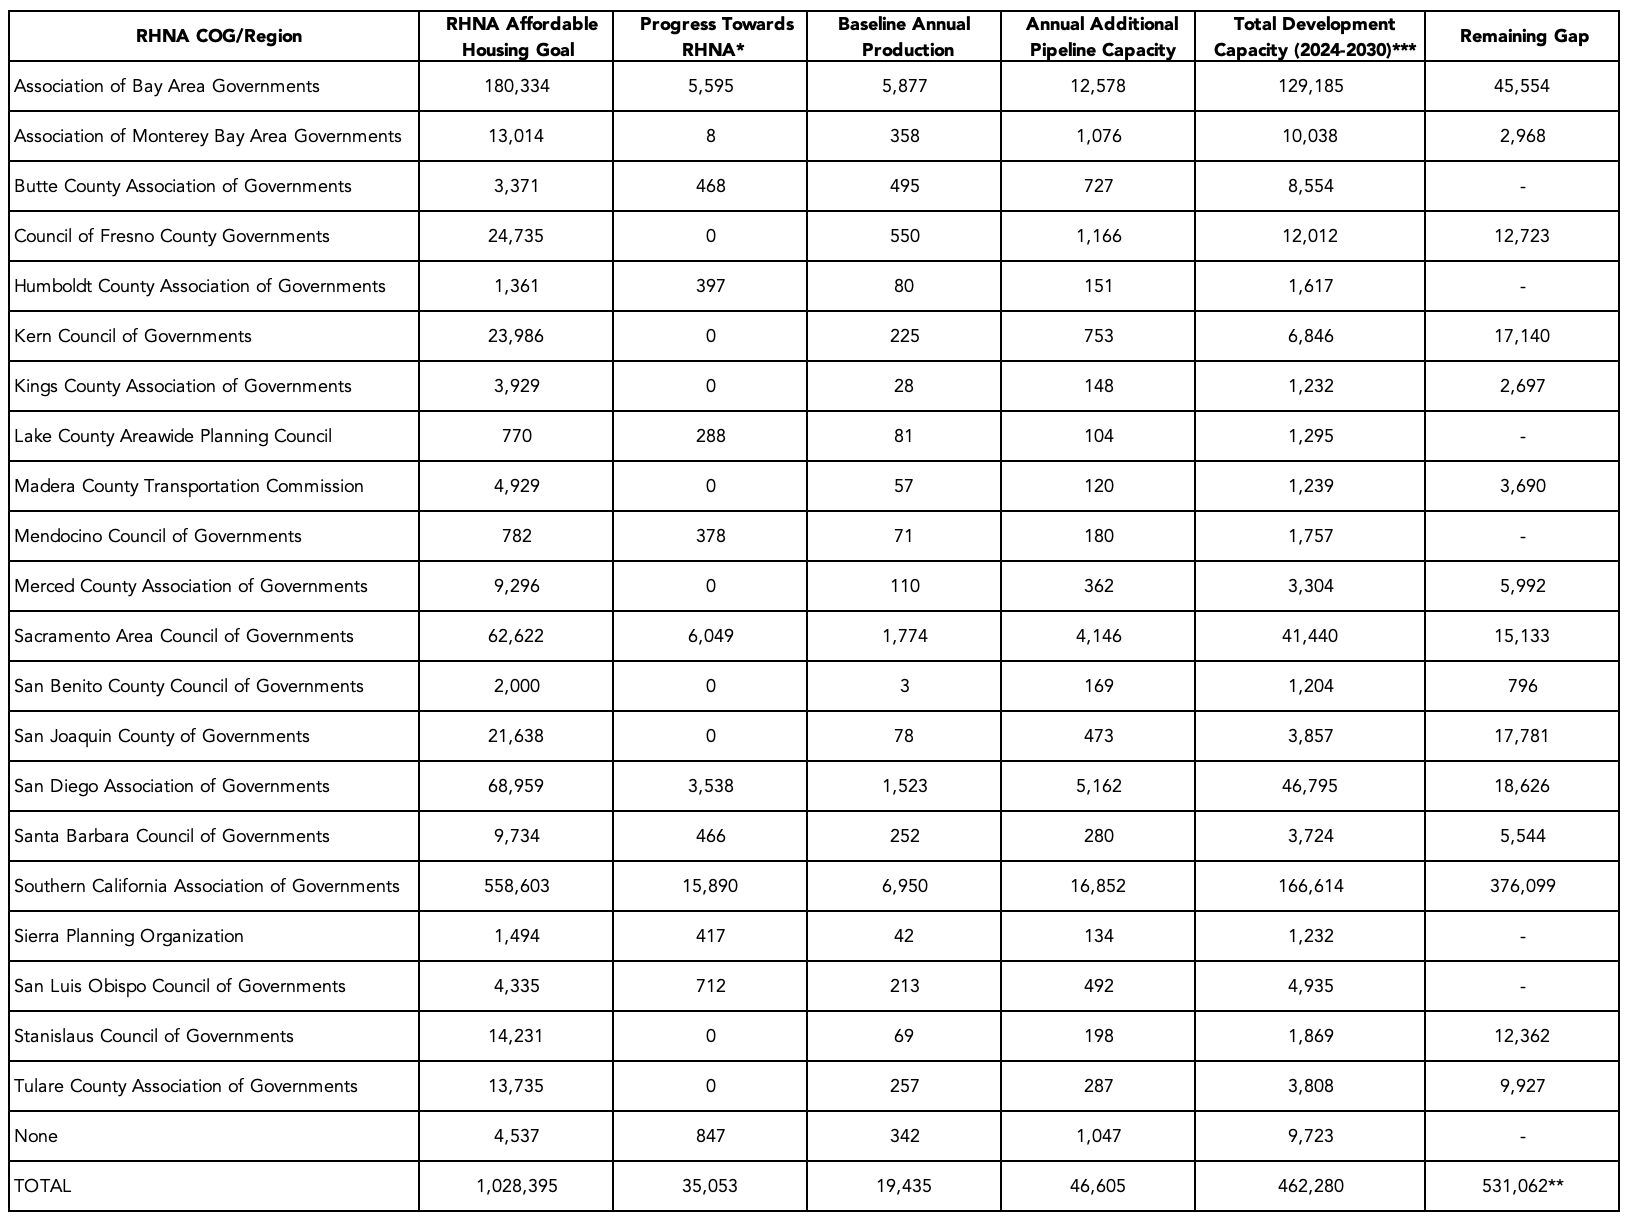
We estimate the statewide gap between affordable housing development capacity – what we can theoretically build – and State affordable housing production goals – what we should build – to be approximately 531,000 affordable homes. Annual capacity is again defined as the combined total of recent annual levels of production and requested funding – in other words, what could theoretically be built each year were State leaders to provide the funding needed to move the size of the current statewide affordable housing pipeline forward expeditiously on an annual basis.7 Production goals are defined as 6th Cycle Regional Housing Need Allocation (RHNA) goals for very low-income and low-income households.
As shown in Figure 2, the degree of difference between capacity and affordable housing goals varies considerably by region. For example, 71 percent of the statewide gap – approximately 376,000 affordable homes – is in the Southern California Council of Governments (SCAG) region, whose affordable housing RHNA allocation comprises just over half of the statewide allocation. The gap in other regions is considerably smaller and in a handful of regions capacity actually exceeds the affordable housing RHNA goal.
We calculate the gap as the difference between 6th cycle RHNA affordable housing goals and the sum of: 1) progress to date in reaching RHNA goals; 2) assumed annual baseline affordable housing production, based on awards in recent years; and 3) assumed annual capacity, based on Enterprise’s analysis.
Figure 2: Gap Between Current Capacity and RHNA Goals

We again note that the Regional Capacity Gap calculation counts Annual Additional Pipeline Capacity – defined as affordable homes in developments that requested but did not receive State funding and/or Housing Credits – as part of the existing capacity calculation. If State leaders do not substantially increase current levels of funding, this capacity will not translate into actual production of affordable homes, leaving regions even further behind in meeting their production goals.
We hope this analysis will serve as a helpful planning tool for housing advocates, public agencies, policymakers, and developers across the state as they strive to build a system that can provide affordable homes to Californians today and into the future.
Please direct any questions about this analysis to Matt Alvarez-Nissen, Research Manager, at mnissen@chpc.net.
Endnotes
1 We are currently in the 6th cycle Regional Housing Needs Allocation (RHNA) planning period for nearly all Councils of Government (COGs) in the state. The planning periods for the largest COGs with the vast majority of the state’s housing need determinations end between 2029 and 2031. For more information, see the California Department of Housing & Community Development’s “Housing Element and Regional Housing Needs Determination Schedule”: https://www.hcd.ca.gov/planning-and-community-development/housing-open-data-tools/housing-element-and-regional-housing-needs-determination-schedule
2 For more information on how to ramp up funding to meet needed levels, see the Roadmap Home: https://roadmaphome2030.org/report/
3 These results should be considered estimates of capacity calibrated to current funding levels; should more funding become available on a consistent basis, development pipelines and applications for funding would be expected to increase in response. However, it may be optimistic to assume developers could produce 66,000 affordable homes each year without some amount of lead time to further build their pipelines if substantially more funding were made available moving forward. The same could be said for other components of the broader development ecosystem, such as construction labor. In addition, achieving this level of affordable housing production each year may require a more efficient State funding system that awards gap financing and Housing Credits in a single application system.
4As shown on page 3 of the California Housing Partnership’s California Affordable Housing Needs Report 2024.
5 Public data from State funding programs is limited and does not make it possible in many cases to identify which pipeline acquisition/rehabilitation developments would lead to preserving affordable homes at high risk of conversion to market rate or convert existing structures and properties to deed-restricted affordable housing, as opposed to acquisition/rehabilitation developments that address capital needs and extend affordability restrictions but would not add or preserve affordable homes. For this reason, the pipeline analysis is limited to new construction developments, which comprise nearly all of the statewide pipeline. For an assessment of preservation needs, see the California Housing partnership’s 2024 reports on the risk of loss of subsidized and unsubsidized affordable homes.
6 Enterprise Community Partners, 2024 California Affordable Housing Pipeline Report: https://www.enterprisecommunity.org/sites/default/files/2024-04/State_Pipeline%20_2024_FINAL_0417.pdf.
7 As previously noted, current levels of State funding allow for only approximately 19,400 affordable homes to be fully funded each year. The recent decision to include another year of $500 million in expanded state Housing Credits and to preserve $315 million of the previously allocated $325 million are good first steps but that, as the Roadmap Home points out, much more will be needed to turn the planned pipeline developments into real affordable homes – and, beyond, to reach State affordable housing production goals.
